Research FAPESP: The metrics of urban growth
Groups in Brazil and abroad use new metrics to identify trends in city growth
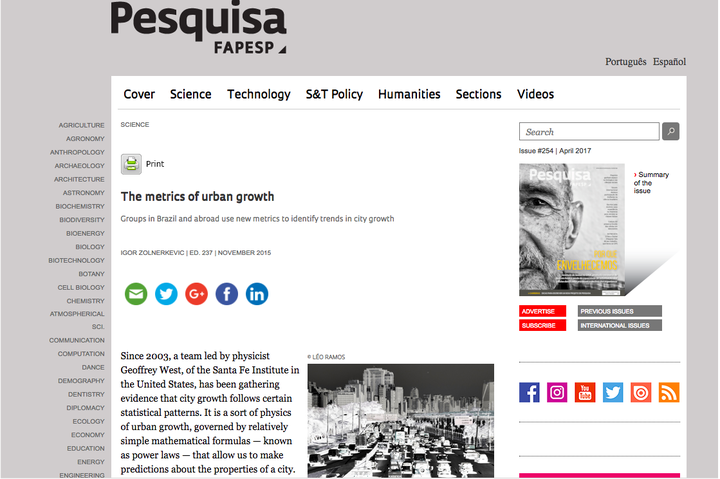
“Since 2003, a team led by physicist Geoffrey West, of the Santa Fe Institute in the United States, has been gathering evidence that city growth follows certain statistical patterns. It is a sort of physics of urban growth, governed by relatively simple mathematical formulas — known as power laws — that allow us to make predictions about the properties of a city. The power laws allow us to estimate the values that the socio-economic and infrastructure indicators of a city can take on with reasonable precision, given only the number of inhabitants. In general, they work for cities of different sizes, from metropolises to villages, with a wide variety of backgrounds and cultures, in Europe, Asia and the Americas.
Brazilian cities also obey these power laws, according to physicists Haroldo Ribeiro, Luiz Alves, Renio Mendes and Ervin Lenzi at the State University of Maringá (UEM) in the state of Paraná. In a study published in September 2015 in the journal PLOS One, they confirmed that one can use these laws to see trends in Brazilian urban development over time and space. Based on these trends, the team from Paraná developed a simple mathematical model and simulated the evolution of eight socio-economic indicators — child labor, unemployment, illiteracy, homicides, family income, the elderly, men and women — for 1,605 Brazilian municipalities. “By placing the results of these predictions on maps, we were able to identify the Brazilian regions in which these indicators are expected to rise, and those in which they should fall, when measured as part of the national census in 2020,” says Ribeiro.
Ribeiro stresses that power laws reveal trends in socio-economic indicators that could be overlooked or distorted by the way in which urban planning specialists normally use them. Reports and guides for public policy usually measure the performance of cities of different sizes, or the development of a single city whose population has grown, by analyzing average socio-economic indicators divided by the number of inhabitants. Thus, they try to determine how unemployment, illiteracy and homicide rates change from one place to another or from one period to another on a per capita basis. “In principal, a per capita analysis eliminates the effect of population size and allows us to compare cities with different-sized populations,” explains Ribeiro. “When we cannot eliminate this effect, however, this analysis can introduce biases into the indicators.”
The origin of these biases arises from the a priori assumptions. By using these indicators to compare cities with different populations sizes, researchers implicitly assume that city growth is always linear. According to this reasoning, a city with 2 million inhabitants would just be a super-sized version of a city with 1 million inhabitants. Thus it would be assumed, for example, that the city with twice as many inhabitants would have twice as many homicides. But this rule does not always work.
Mice and elephants
Calculations carried out by Ribeiro and his colleagues indicate that, in 2010, a Brazilian city with 2 million inhabitants would tend to have more than twice as many homicides — more precisely, 2.44 times as many homicides — than a city with half that population. This finding shows that per capita indices do not completely eliminate the effect of population size and that large cities are not just bigger versions of small cities. They are qualitatively different. And the ways in which they differ resemble what happens with large and small animals, such as the elephant and the mouse.
In the 1930s, the Swiss biologist Max Kleiber studied the influence of size on mammals in terms of the physiology of their bodies. Kleiber compared the number of calories that animals of different species need to consume daily to stay alive. He found that, regardless of size, the animals’ metabolism always obeyed a mathematical power law. In the case of mammals, the amount of energy needed to live increased according to a power law with an exponent of 0.75. This means that an animal twice the size needed to consume only 1.68 times the calories, and not twice as much.
The fact that this exponent is less than one means that a larger animal needs proportionally less energy than a smaller one. For this reason, an elephant needs 40,000 kcal per day to stay alive, while a mouse consumes just 4 kcal. The amount of energy an elephant ingests is 10,000 times greater than that of the mouse, but his mass is 220,000 times greater. In the late 1990s, Geoffrey West and his group discovered that this difference is due to how energy is distributed in the body: the larger the animal, the more efficiently energy is distributed to the different parts of its body.
In 2003, West and his team found that an identical power law matches the growth of cities. Data from cities in the United States, Europe and Asia showed that urban infrastructure indicators, such as the number of gas stations, the highway network, and the total length of power network cables increases with city population size according to Kleiber’s law. When the population of a city doubles, the infrastructure needed to serve it does not need to be twice as large, but rather just 1.68 times larger — and this factor varies little from country to country. “It is as if the larger city were optimizing resource use,” explains Ribeiro. Mathematicians and physicists call this growth pattern sublinear.
A similar power law governs the growth of socio-economic indicators. But the rate is different. While infrastructure indicators tend to grow more slowly as the population increases, socio-economic indices increase more rapidly, more that twice as fast when the city population doubles. West observed that, in these cases, economic growth indicators such as gross domestic product and the number of patents generated increased about 2.22 times. From an economics standpoint, then, a city with 2 million inhabitants is more efficient and productive than two cities with 1 million inhabitants each — a growth pattern known as superlinear. Unfortunately, as any inhabitant of a metropolis can guess, indicators of poor quality of life, such as unemployment or homicide rates, also grow more or less proportionally.
However, there are exceptions. Not all indicators increase in a non-linear manner. Some of them — both infrastructure and socio-economic indicators — can grow linearly with population, such as power consumption per residence. There are also categories of indicators that can have different growth rates. In an article published in August 2015 in the Journal of Urban Health, a team led by Brazilian physicist Luis Rocha, of the Karolinska Institute, in Sweden, compared several public health indicators in cities in Brazil, the United States, and Sweden. In the three countries, the incidence of infectious diseases such as influenza and AIDS increased superlinearly, perhaps because the crowding of people in cities facilitates transmission of these illnesses. On the other hand, deaths due to heart attack and suicide grew sublinearly. The explanation for this result is still controversial. The researchers suspect that it is related to the fact that larger cities have better-structured hospital networks and it is more difficult to become isolated socially.
Brazilian development
In the PLOS One article, Ribeiro and his colleagues analyzed the data from 1,605 Brazilian municipalities, obtained for 1991, 2000 and 2010 by the Brazilian Institute of Geography and Statistics (IBGE) and by the IT Department of the Unified Health System (DataSUS). As expected, the socio-economic indicators for family income, unemployment and homicides grew superlinearly with respect to population. However, child labor and illiteracy followed a different pattern, growing sublinearly: larger cities seem to eradicate these problems more easily.
The researchers observed another clear trend: over the period studied, the rates measured in Brazilian cities were close to the figures estimated by the power laws. In 1991, for example, the city of Peixoto de Azevedo, in Mato Grosso State, had a much larger number of homicides than expected for a city of its size. Over the last few decades, however, the number of homicides in the city has fallen, becoming closer to the figure estimated by the power law calculated by Ribeiro’s team. At the same time, Brazilian cities that had fewer homicides than expected according to the power law suffered an increase in murders. Ribeiro attempts an explanation. “It seems that, when there are too many homicides, citizens become worried and pressure politicians to reduce them,” he speculates. “But when the homicide rate is very low, people don’t seem to pay attention to the problem and the rate soon increases.” Of the eight indicators analyzed by the group, the only one that does not follow this trend is illiteracy, which tends to rise in cities in which it is already high and fall in cities in which it is already low. “It appears to be a self-perpetuating effect,” Ribeiro suggests. “The more educated people are, the more education they demand.”
“Power laws allow us to make predictions, but these indices also depend on government policies, which is not taken into account by this study,” criticizes geographer Cosmo Antonio Ignazzi, of Université Paris 1, France, which studies power laws in Brazilian cities. Ribeiro recognizes the problem and believes it is very difficult to quantify the effects of public policy in a mathematical model. “Our model is not deterministic,” Ribeiro stresses. “However, our work and that of other researchers shows that the effect of these policies is limited by the size of the city’s population.”
Ignazzi also questions the way in which the physicists defined urban areas in their analysis, treating each municipality as a city. “The study’s methodology is good, but they used the wrong unit. Municipalities are political-administrative units. This is not a good choice, since it does not take into account the large metropolitan regions around Brazilian capitals such as Manaus, Salvador, São Paulo and Rio de Janeiro.”
“It is true that the definition of the urban unit is crucial, but there is not yet a fail-proof procedure for defining the limits of a city,” responds Ribeiro. “In our work we compared the results of grouping the data for the municipalities in the 39 metropolitan regions in Brazil with the results of not grouping the data, and we saw no appreciable difference in our conclusions.”
Scientific Articles
ALVES, L. G. A. et al. Scale-adjusted metrics for predicting the evolution of urban indicators and quantifying the performance of cities. PLOS ONE. Sept. 10, 2015. ROCHA, L. E. C.; THORSON, A. E; LAMBIOTTE, R. The non-linear health consequences of living in larger cities. Journal of Urban Health. V. 92 (5), p. 785-99. Oct. 2015.”
Original source: Research FAPESP
Read our article at: Scale-adjusted metrics for predicting the evolution of urban indicators and quantifying the performance of cities, PLoS ONE 10, e0134862 (2015).